
The OGM Interactive Edition - Summer 2023 - Read Now!
View Past IssuesOUR GREAT MINDS
OUR GREAT MINDS
Energy affordability and security are significant global challenges. Liquefied natural gas (LNG)1 can play a crucial role in helping the world achieve energy affordability and security. LNG is an increasingly important component of the international natural gas trade; in 2021, the value of the global trade in LNG reached US$157 billion annually. The global share of LNG as a proportion of all-natural gas imports increased from 19 percent in 1995 to 40 percent in 2020. In Asia, 40 percent of the natural gas imported is in LNG form.
However, despite its abundance of natural gas, Canada exports no LNG. It has only one export terminal (LNG Canada) under construction in British Columbia. At least four additional facilities are proposed for British Columbia, including Woodfibre LNG, Tilbury LNG, Cedar LNG, and Ksi Lisims LNG. While Canada has remained on the sidelines, other nations have attracted LNG investment and benefited from the rise in LNG export markets. Qatar is building three new LNG projects; Russia is building four new LNG projects, and five new projects are under construction in the United States (IGU, 2021).
There has been significant discussion among policymakers and others as to why LNG projects have not proceeded in Canada beyond the planning stage, except for the one LNG Canada project now under construction in British Columbia (McConaghy and Wallace, 2019; Grant and Grant, 2019).
This CEC Research Brief aims to focus not on that debate, but to review the growth in the global LNG market and the opportunities and challenges Canada faces if it is to be part of the lucrative global LNG trade.
Canada has abundant natural gas resources and is a net exporter of natural gas, with all of its exports going to the United States. Still, growing shale gas production in the U.S. has reduced that country’s demand for Canadian gas (Moore et al., 2014).
Consequently, natural gas producers in Canada, as well as those in the U.S., have sought overseas markets for their natural gas exports, including Asian markets where gas transportation through pipelines is not feasible (Moore et al., 2014). U.S. natural gas producers have increased LNG exports in recent years. In 2022, the U.S. became the world’s largest exporter of LNG, overtaking Australia and Qatar. Canadian natural gas producers have been limited— for various reasons—to one export market, the United States.
Many countries are active players in global LNG markets; they are currently operating export terminals and constructing additional facilities. In Canada, at one time, 18 LNG projects had been proposed (Natural Resources Canada, 2020). However, only one is currently under construction due to delays caused by the regulatory regime, financial barriers, or opposition to the projects, including anti-oil and gas activists (McConaghy and Wallace, 2019).
According to the International Energy Agency (IEA, 2020a), the 2020 decline in natural gas demand will reverse in 2021 and return to its higher pre-Covid-19 levels, with consumption rising even higher in the coming years. Of note, the Asia-Pacific region will account for half of the growth in global natural gas consumption. Global natural gas consumption showed a strong recovery in 2021, with an estimated increase of over four percent 2021 over 2020.
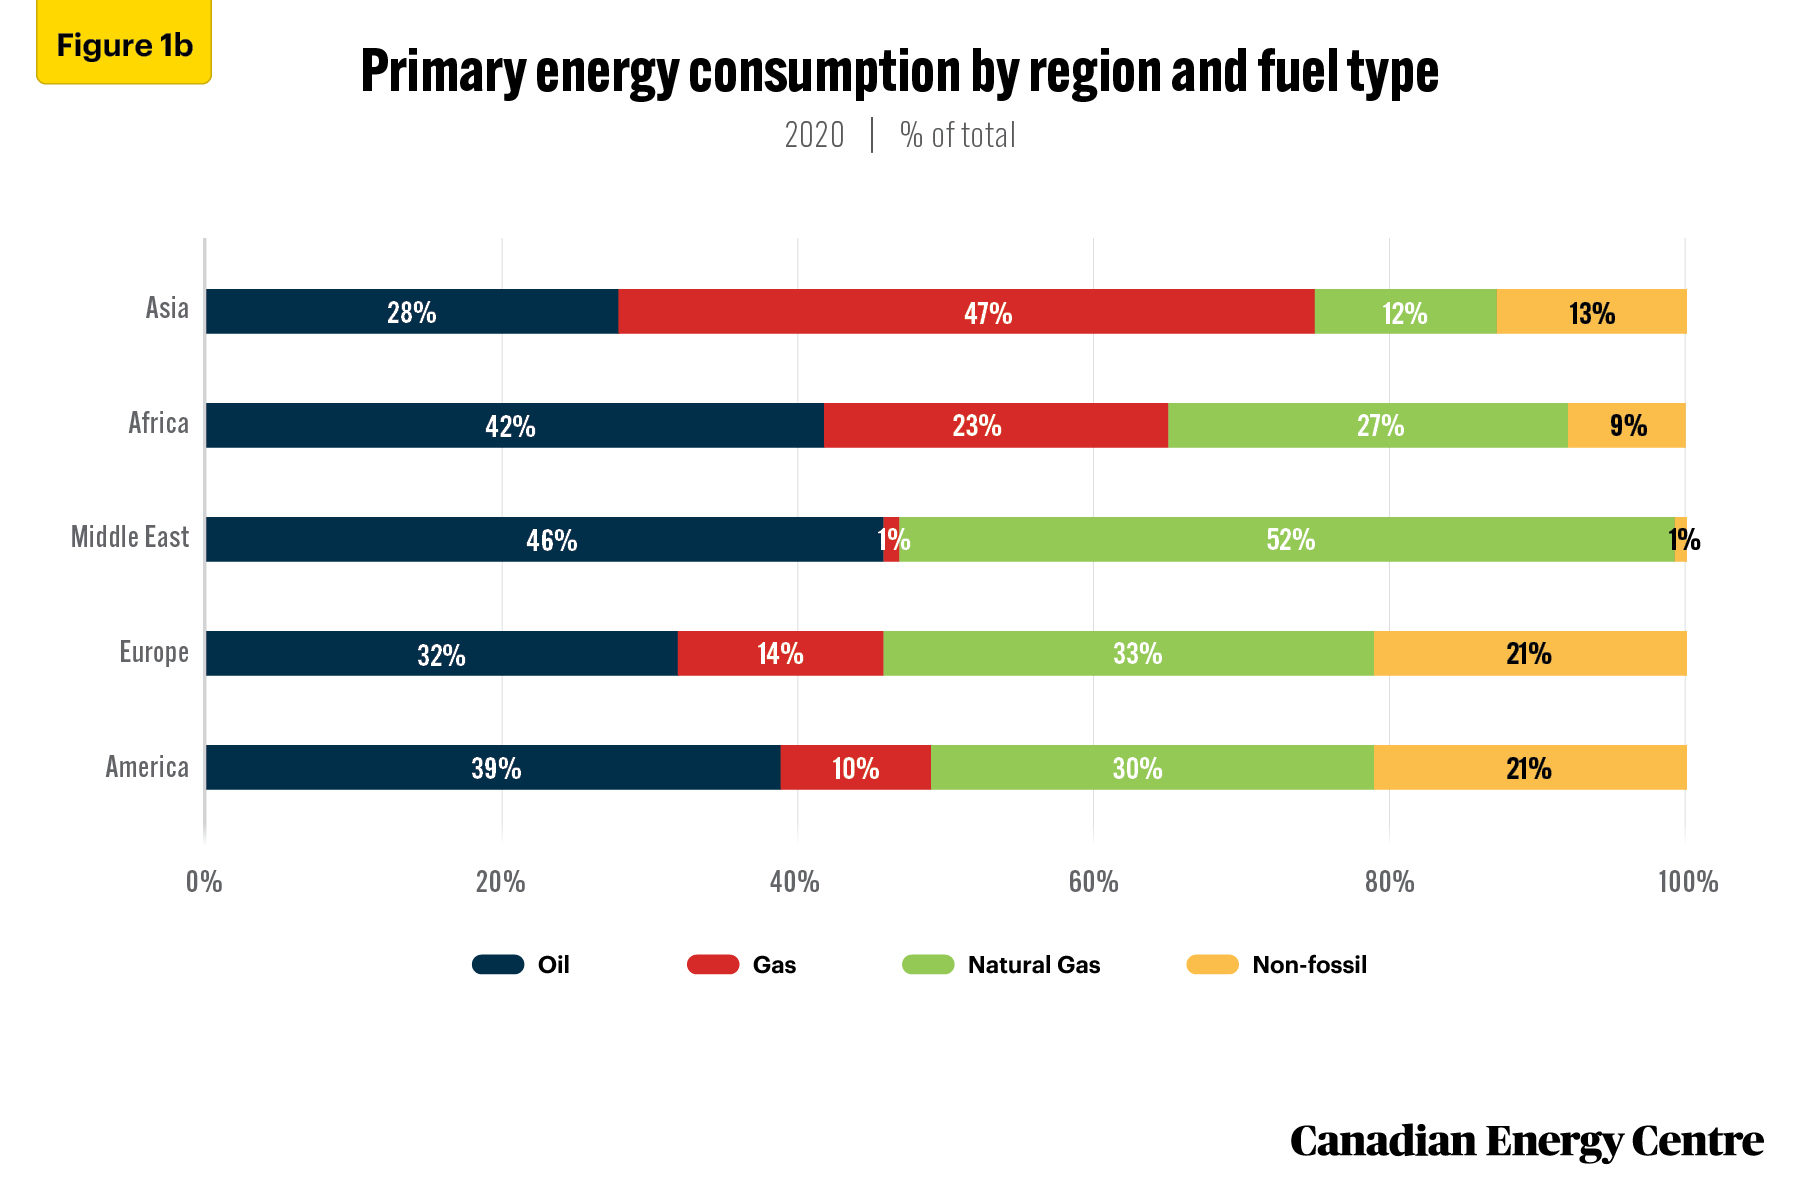
Between 1990 and 2020, global primary energy consumption increased from 342 exajoules (EJ) to 556 EJ. In the same period, the natural gas market share grew from 21 percent in 1980 to 25 percent in 2020 (see Figure 1A). In Europe, primary energy consumption accounts for 33 percent of the natural gas it uses, while in Asia, primary consumption accounts for 12 percent of natural gas usage. Asia is more reliant on coal for its energy needs and less reliant on natural gas than other regions (see Figure 1B) (B.P. Statistical Review of World Energy database, 2022).

The growth in the consumption of natural gas has led to increased international natural gas imports both through pipelines and, where pipelines are not feasible, LNG. The international imports of LNG have risen from 75,968 in 1990 to 460,547 Mm3 in 2020 (see Figure 2) (Enerdata, 2022).

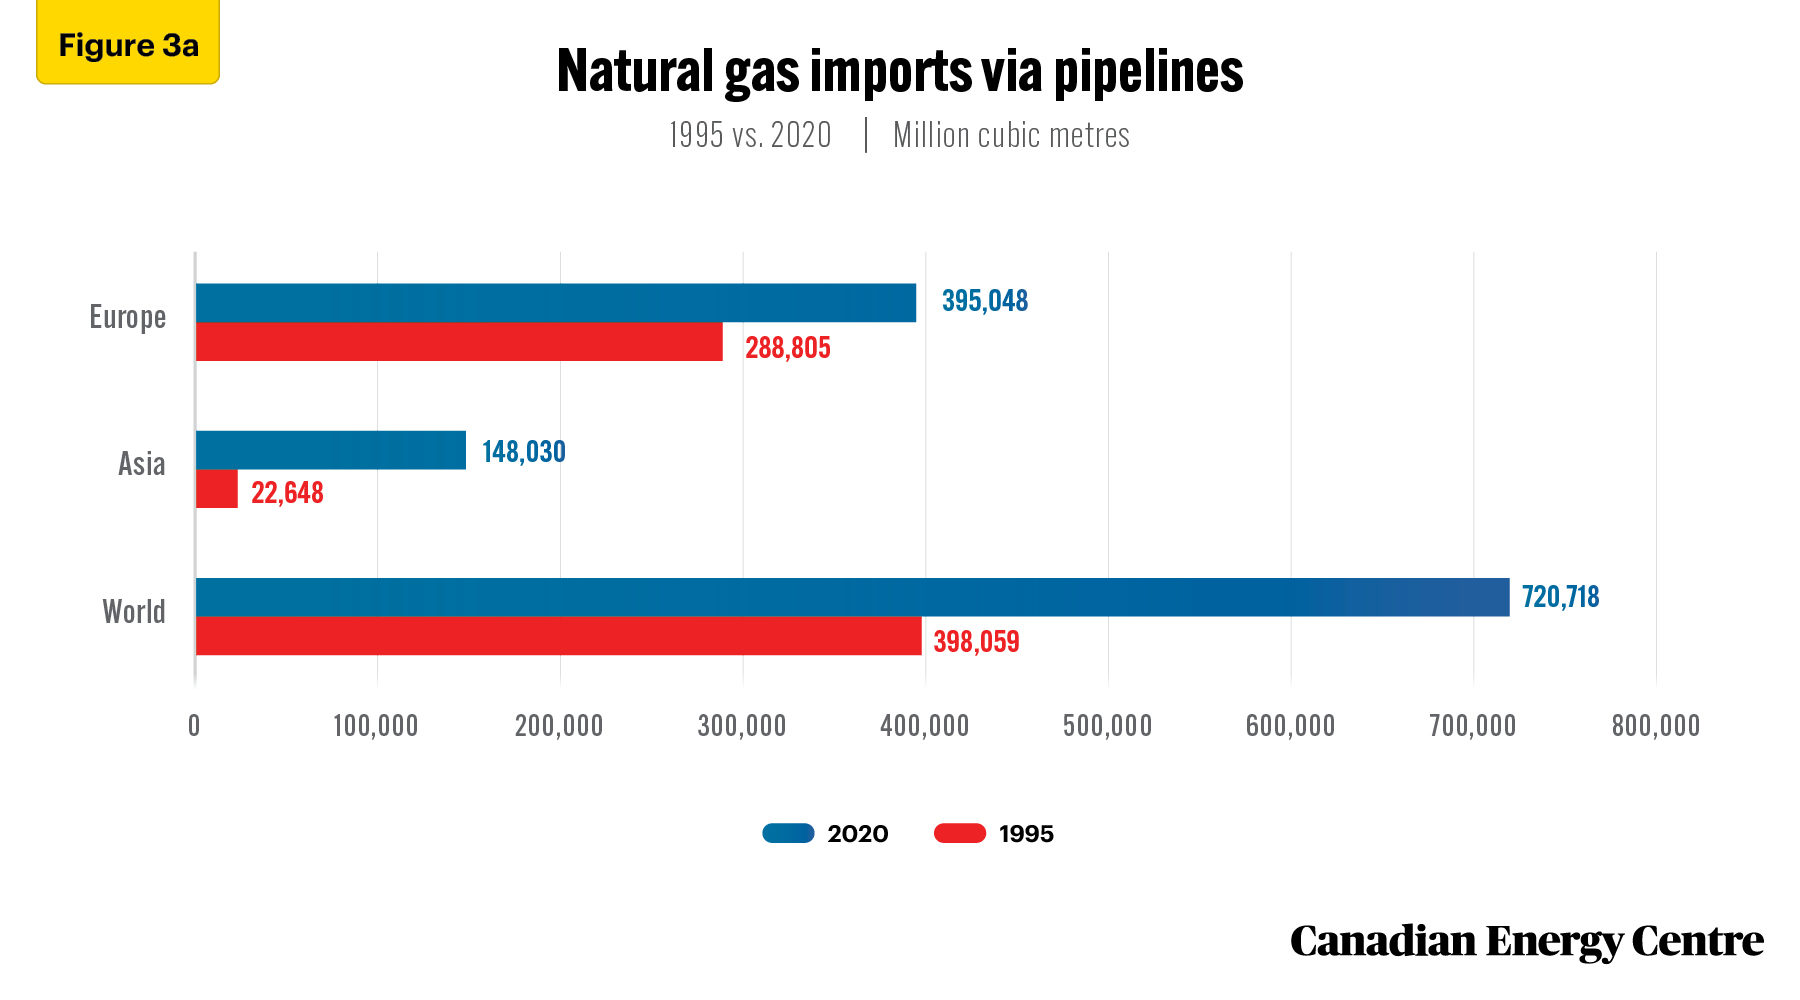
Worldwide imports of natural gas through pipelines rose from 398,059 Mm3 in 1995 to 720,718 Mm3 in 2020, increasing 322,659 Mm3 or 81 percent. The breakdown by region is as follows (see Figure 3a):
• Europe: 395,048 Mm3 in 2020, 37 percent higher than in 1995; and
• Asia: 148,030 Mm3 in 2020, 553 per cent higher than in 1995 (Enerdata, 2022).
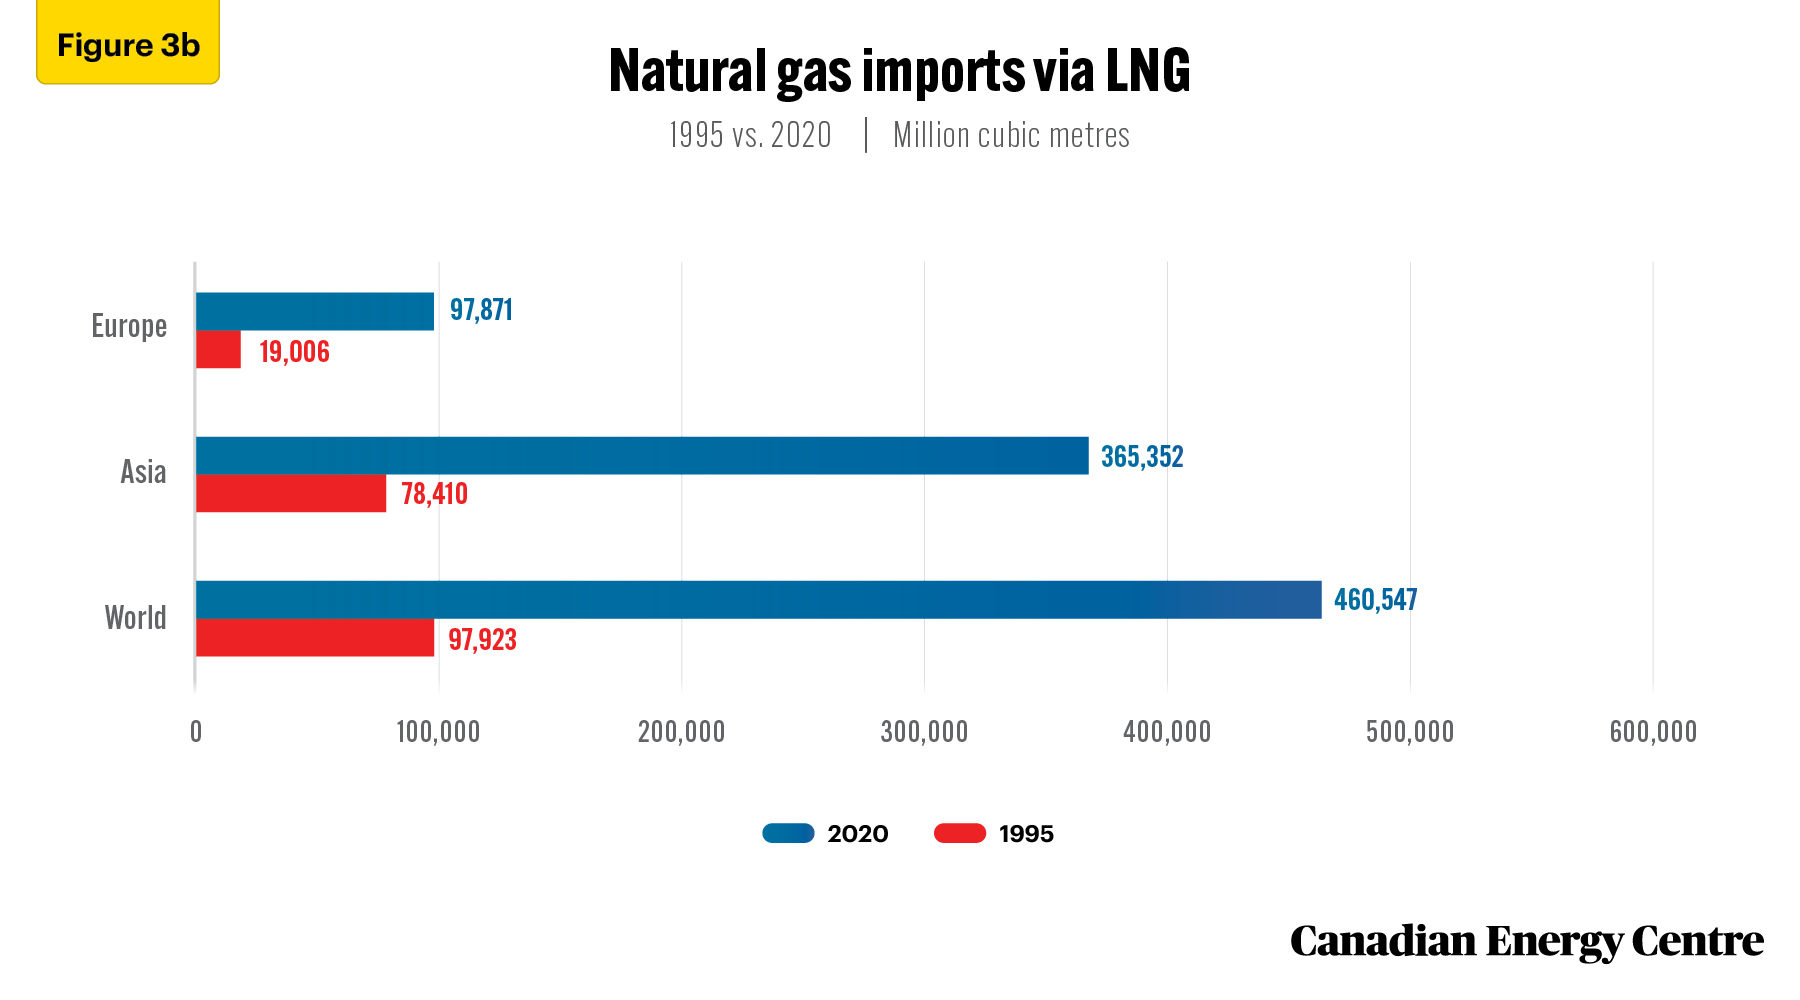
Worldwide imports of natural gas via LNG rose from 97,923 Mm3 in 1995 to 460,547 Mm3 in 2020, an increase of 362,624 Mm3, or 370 percent. The breakdown by region is as follows (see Figure 3b):
• Europe: 97,871 Mm3 in 2020, 414 percent higher than in 1995; and
• Asia: 365,352 Mm3 in 2020, 365 percent higher than in 1995. The sharpest rise in LNG imports by volume occurred in Asia (up 286,942 Mm3) (Enerdata, 2022).
Australia, Qatar, and the United States (U.S.) are the world’s top exporters of LNG. In 2020, Australia exported 108,047 Mm3 of LNG (see Figure 4a) and accounted for 22.6 percent of global LNG exports. It was followed by Qatar (22 percent) and the U.S. (12 percent) (see Figure 4b) (B.P. Statistical Review of World Energy database, 2022).
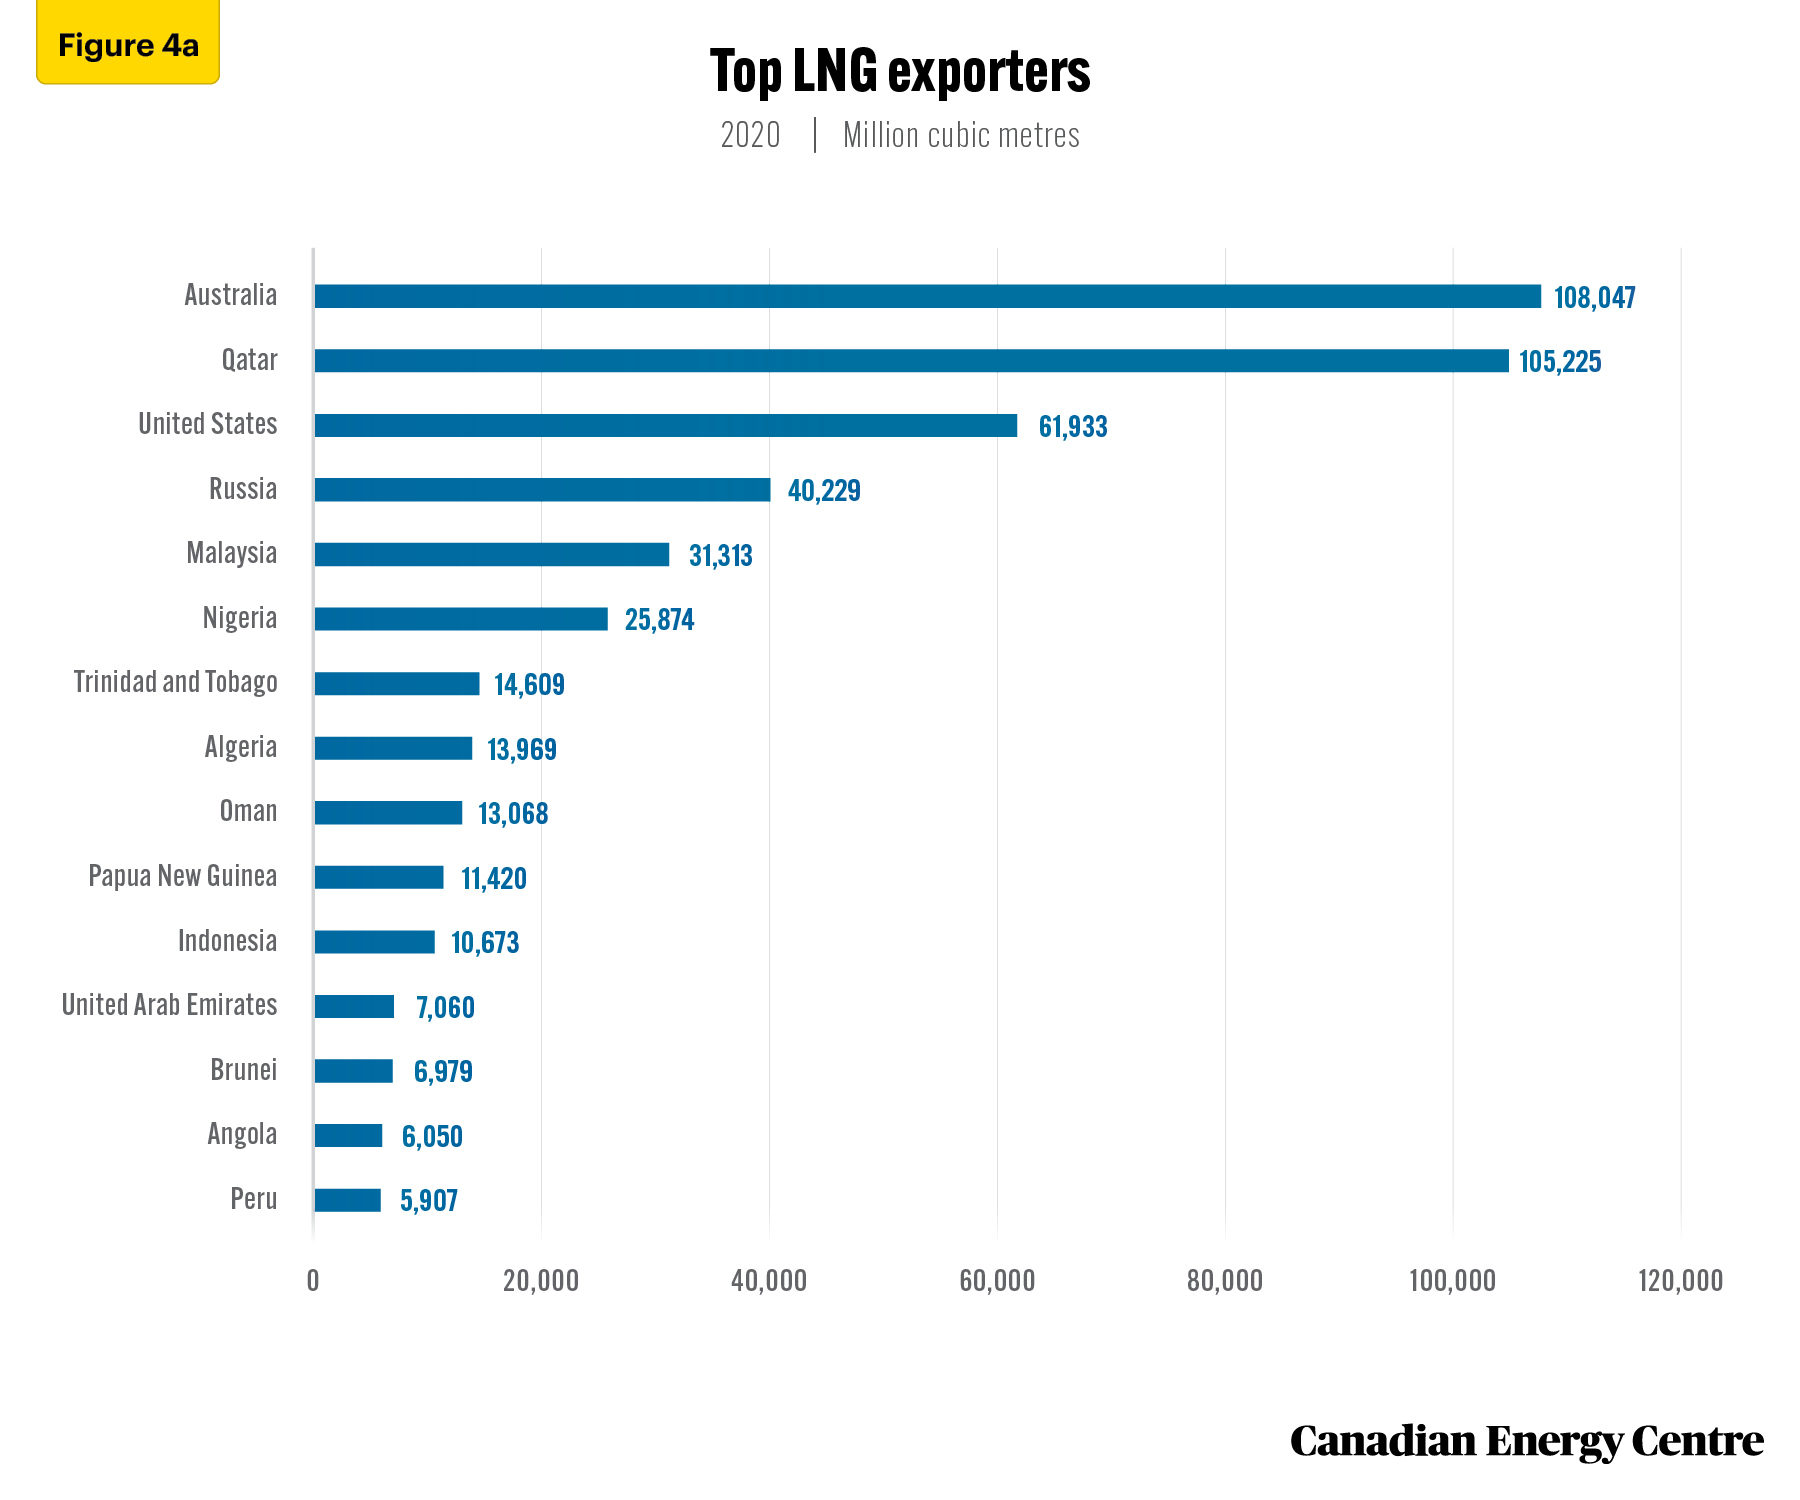

Several countries, including those listed below, have seen their LNG exports grow significantly between 1990 and 2020 (see Figure 5). They are, in order of the size of the LNG export increase by Mm3:
• Australia: 2,791 Mm3, in 1990 to more than 108,047 Mm3 in 2020, or 3,777 percent higher;
• Qatar: 2,604 Mm3 in 1997 to 105,225 mm3 in 2020, or 3,940 per cent higher;
• United States: 1,351 Mm3 in 1990 to 61,933 Mm3 in 2020, or 4,484 percent higher;
• Malaysia: 10,295 Mm3 in 1990 to 31,313 Mm3 in 2020, or 204 percent higher; and
• Russia: 7,383 Mm3 in 2009 to 40,229 Mm3 in 2020, or 444 per cent higher (Enerdata, 2022).
Despite the global rise of LNG exports and the significant increases in LNG exports from the countries noted above, Canada has yet to participate in the LNG export market.

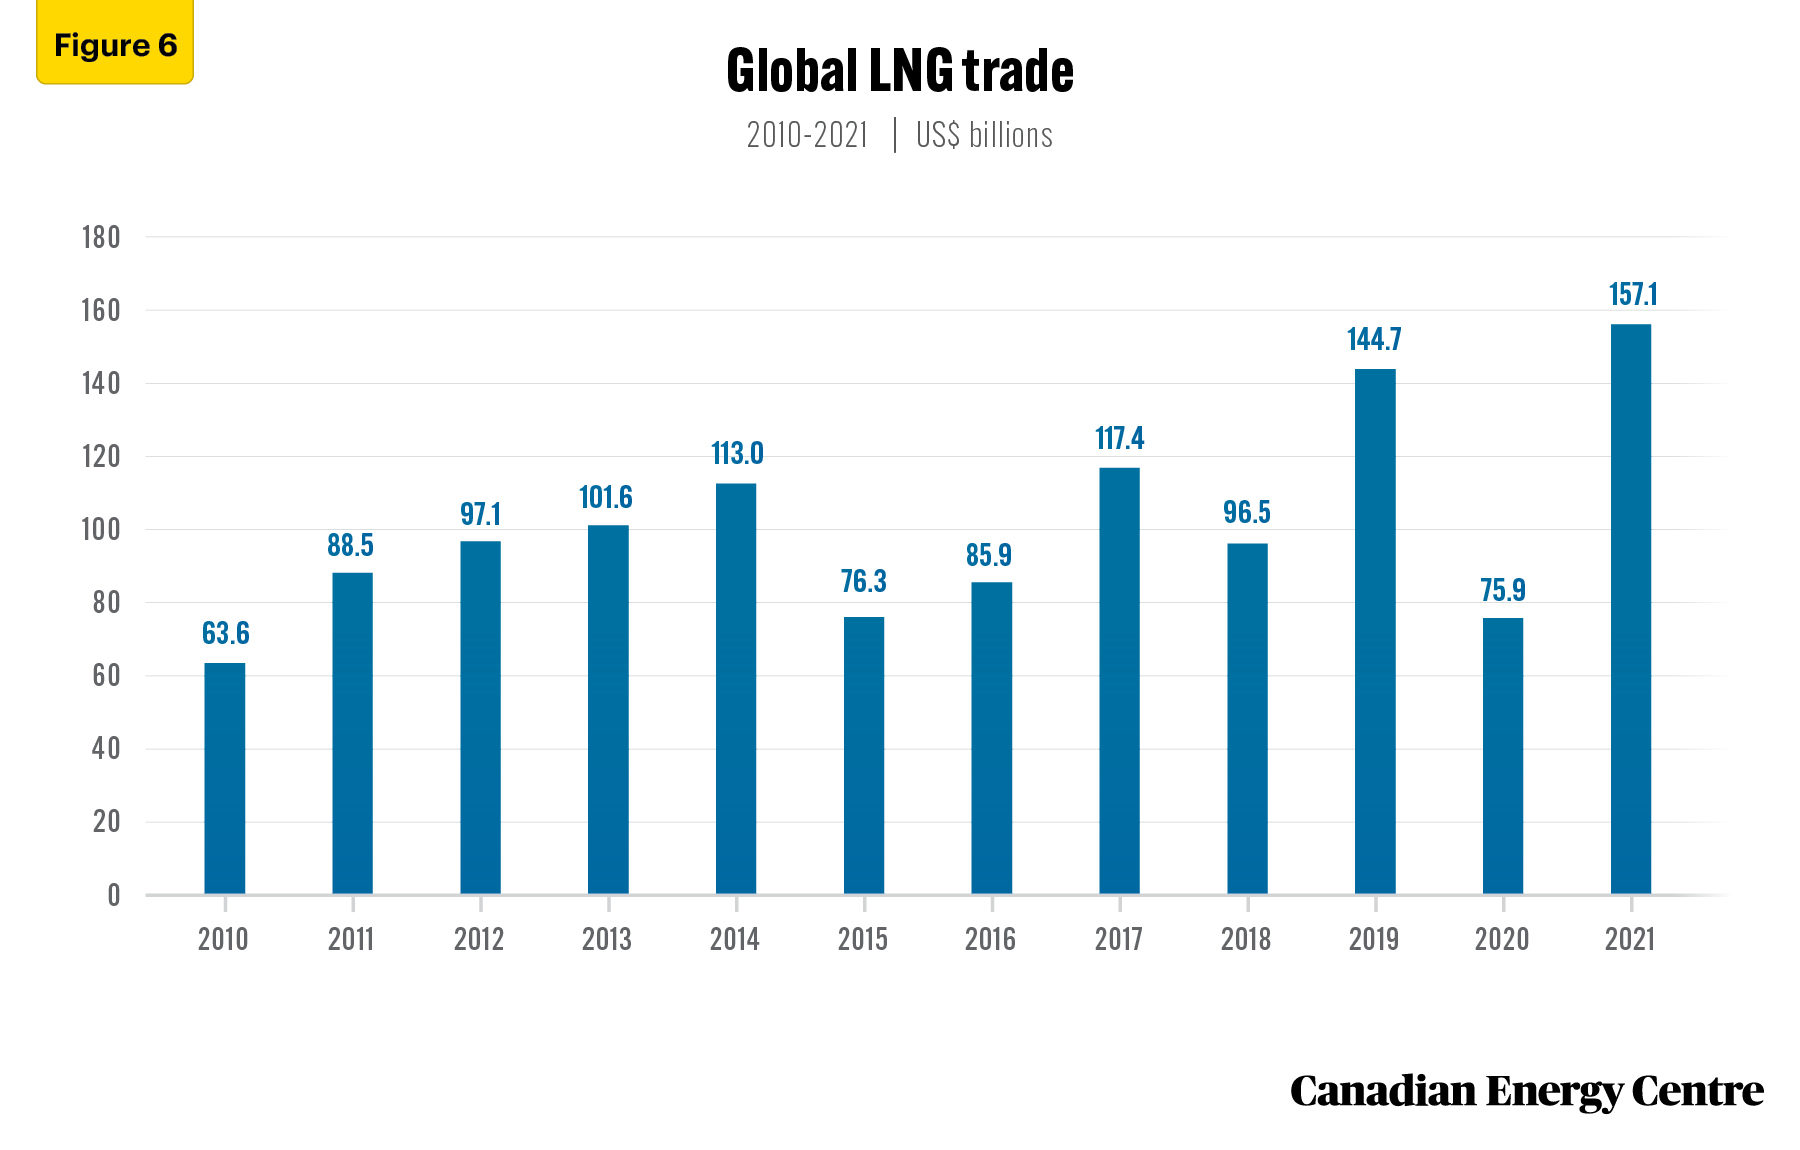
Over the past decade, the global LNG trade has increased by 147 percent. In 2010, total LNG exports were worth just over US$63.6 billion, a figure that increased to almost US$ 117.4 billion by 2017, before declining to about US$75.9 billion due to COVID-19 and then again increasing to US$157.1 billion in 2021 (see Figure 6) (International Trade Centre, undated).
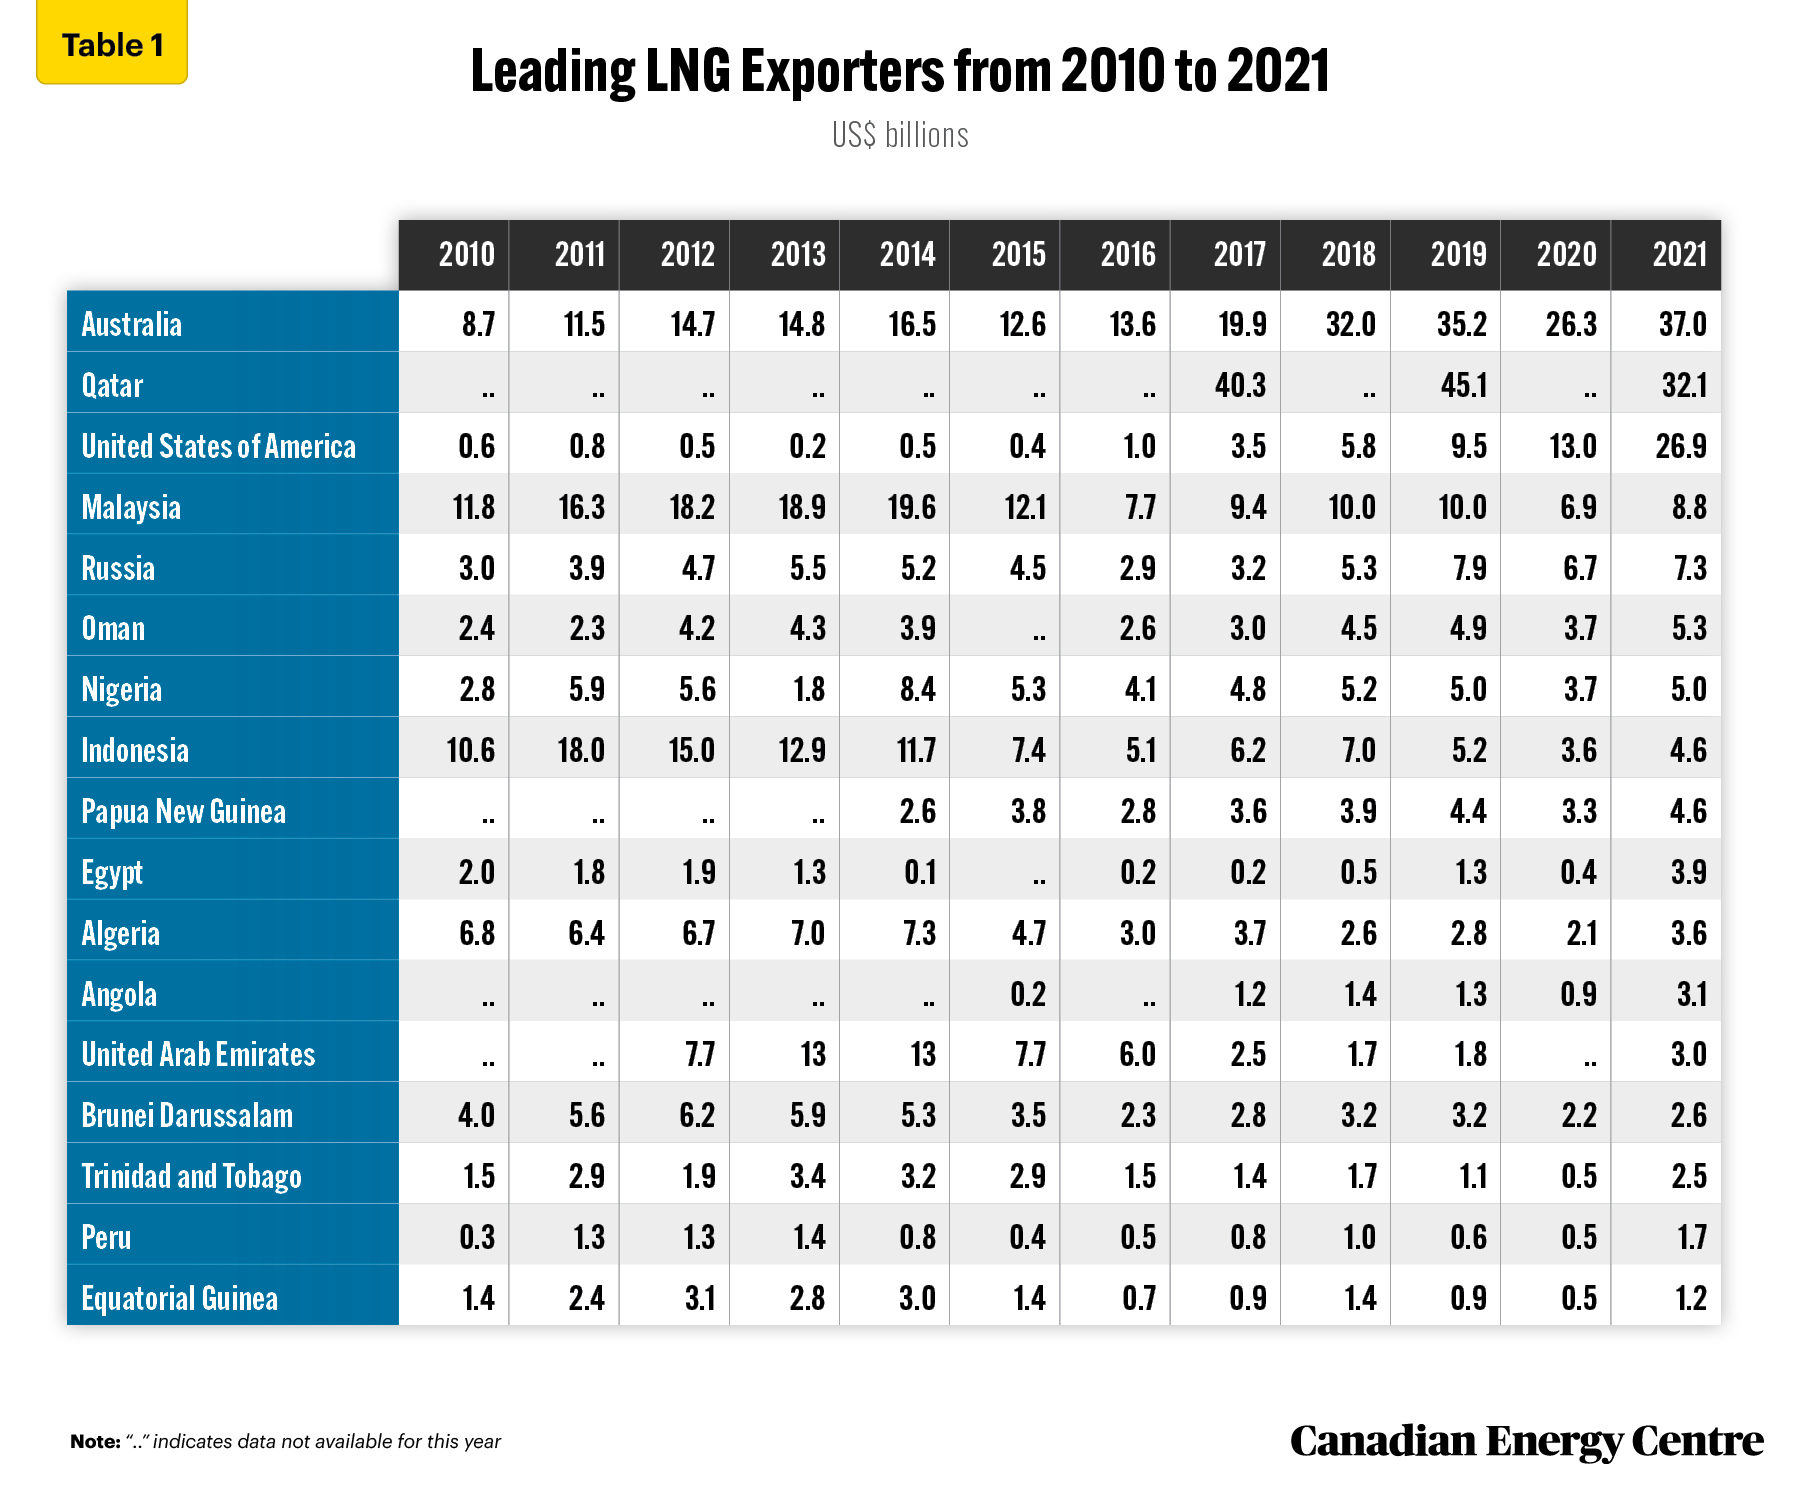
Between 2010 and 2021, Australia, Qatar, and the United States were the largest exporters of LNG. In 2021 alone, Australia’s LNG exports totaled US$37 billion, an increase of US$28.3 billion from its US$8.7 billion total in LNG exports in 2010. Data are available only intermittently for Qatar, but in 2017 alone, the country exported over $40 billion in LNG. U.S. LNG exports increased from US$600 million in 2010 to nearly $27 billion in 2021. Even new entrant Angola increased its LNG exports from US$200 million in 2015 to US$3.1 billion in 2021 (see Table 1) (International Trade Centre, undated).
As of 2021, 21 countries were LNG exporters (International Gas Union, 2021). To be competitive in the LNG export market requires a significant investment of capital and time. That is partly because it takes more than ten years on average to complete an LNG terminal from the start of the planning stage to the day that exports begin leaving the terminal (PWC, 2014).
Countries that export natural gas by sea require a liquefaction terminal, which turns natural gas into a liquid to make it suitable to transport. Presently, there are more than 115 liquefaction plants in the world. At 21 facilities, Australia has the greatest number of operational LNG export terminals. The United States follows with 17, while Qatar has 14 LNG export terminals (Enerdata, 2022).
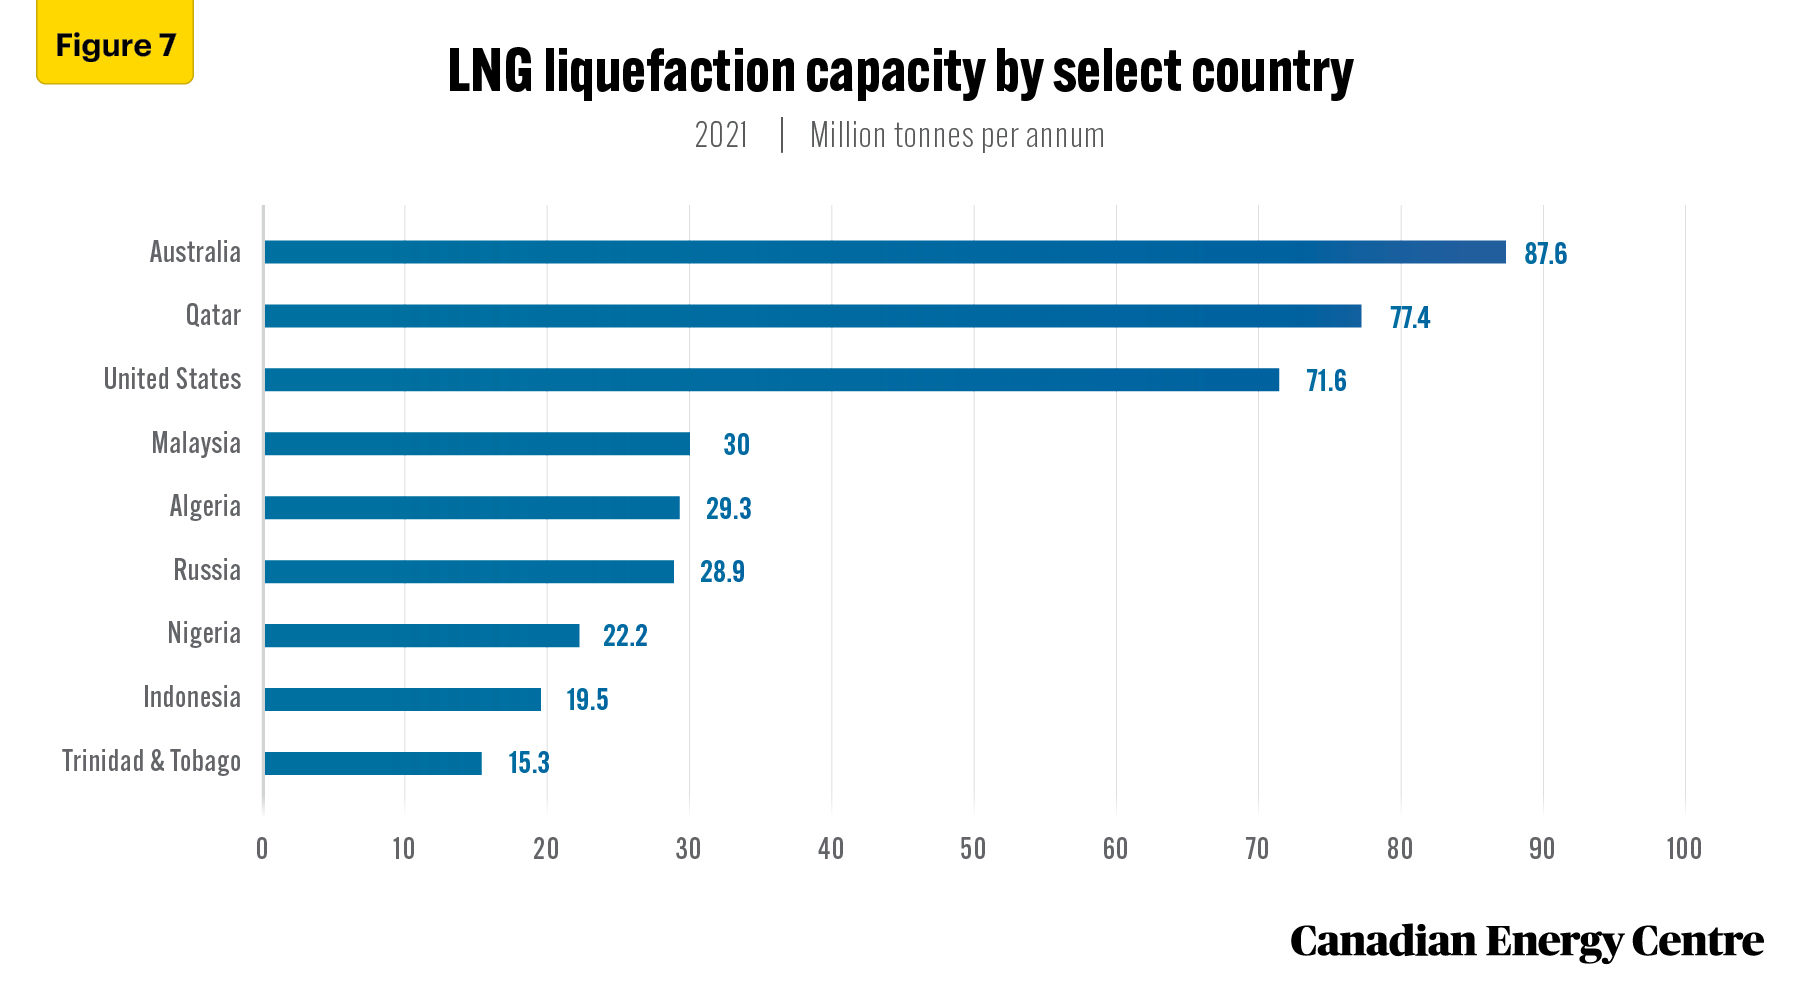
Total liquefaction capacity worldwide was 452.9 million tonnes per annum (MTPA)³ in 2020. Australia has the most liquefaction capacity at 87.6 MTPA, followed by Qatar (77.4 MTPA) and the U.S. (71.6 MTPA) (International Gas Union, 2021). The top three countries, the U.S., Qatar, and Australia account for more than half of the global liquefaction capacity (see Figure 7).
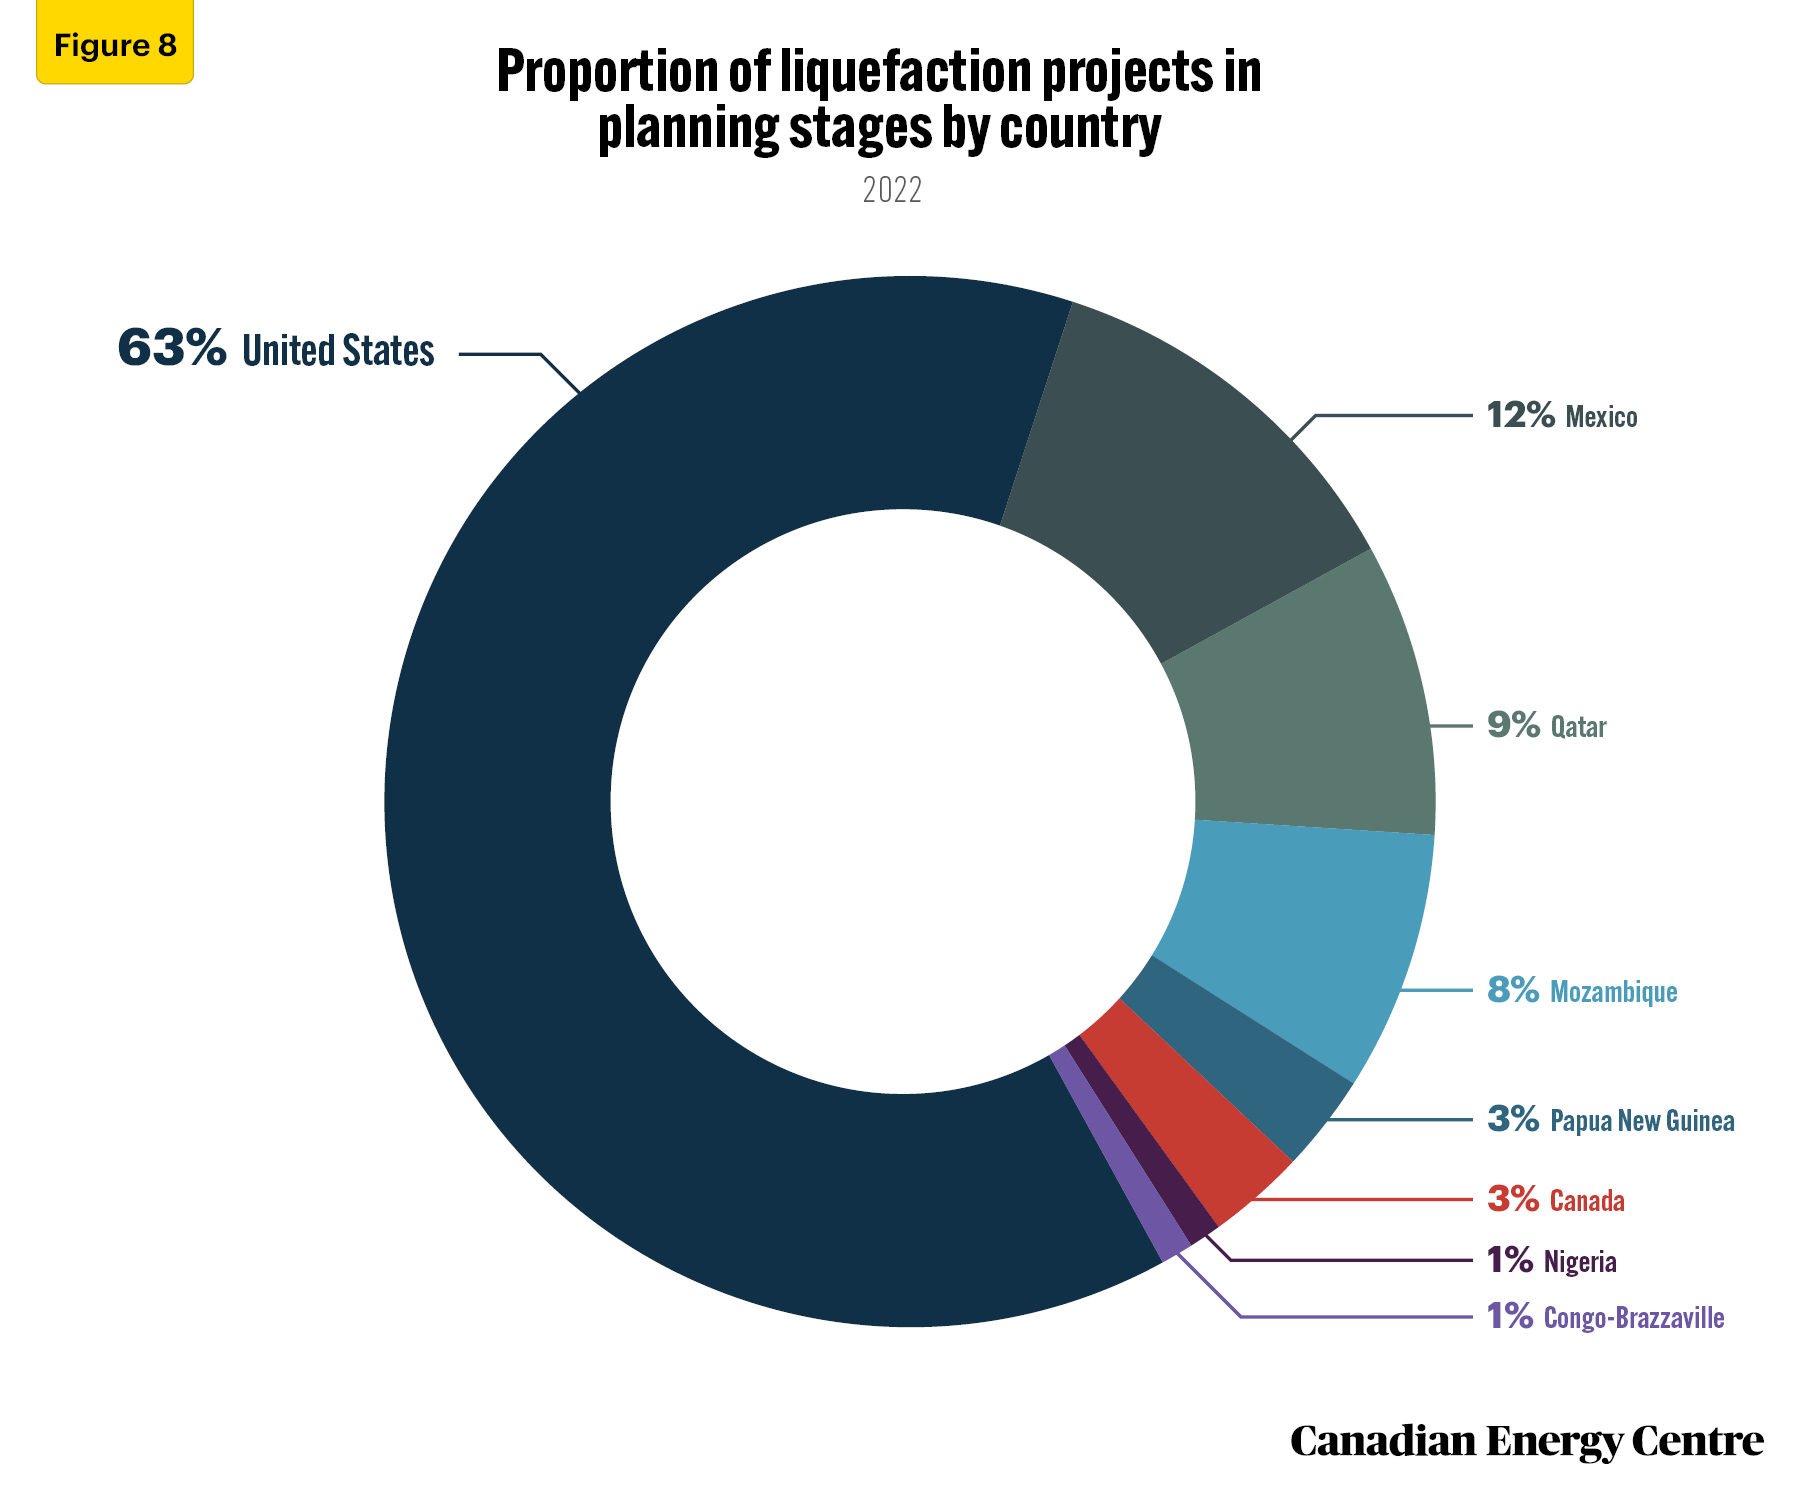
More than 20 unsanctioned projects with a liquefaction capacity of over 186 MTPA are in the planning stage and reported some developmental progress around the globe (Rystad, 2022b). Currently, at this time, Canada’s share is just three percent (see Figure 8), but, as discussed below, there is much more potential from Canada in the longer term.
The prospects for growth in the Canadian LNG industry have brightened over the last few months. High natural gas prices and ongoing energy supply disruptions in Europe due to the Russia-Ukraine conflict have created a unique opportunity and challenge for the Canadian energy sector. At the same time, natural gas and LNG are seen as fuels that can be relied upon as the world transitions to a low-carbon economy, especially in Asia, which is currently highly reliant on coal for its energy needs.
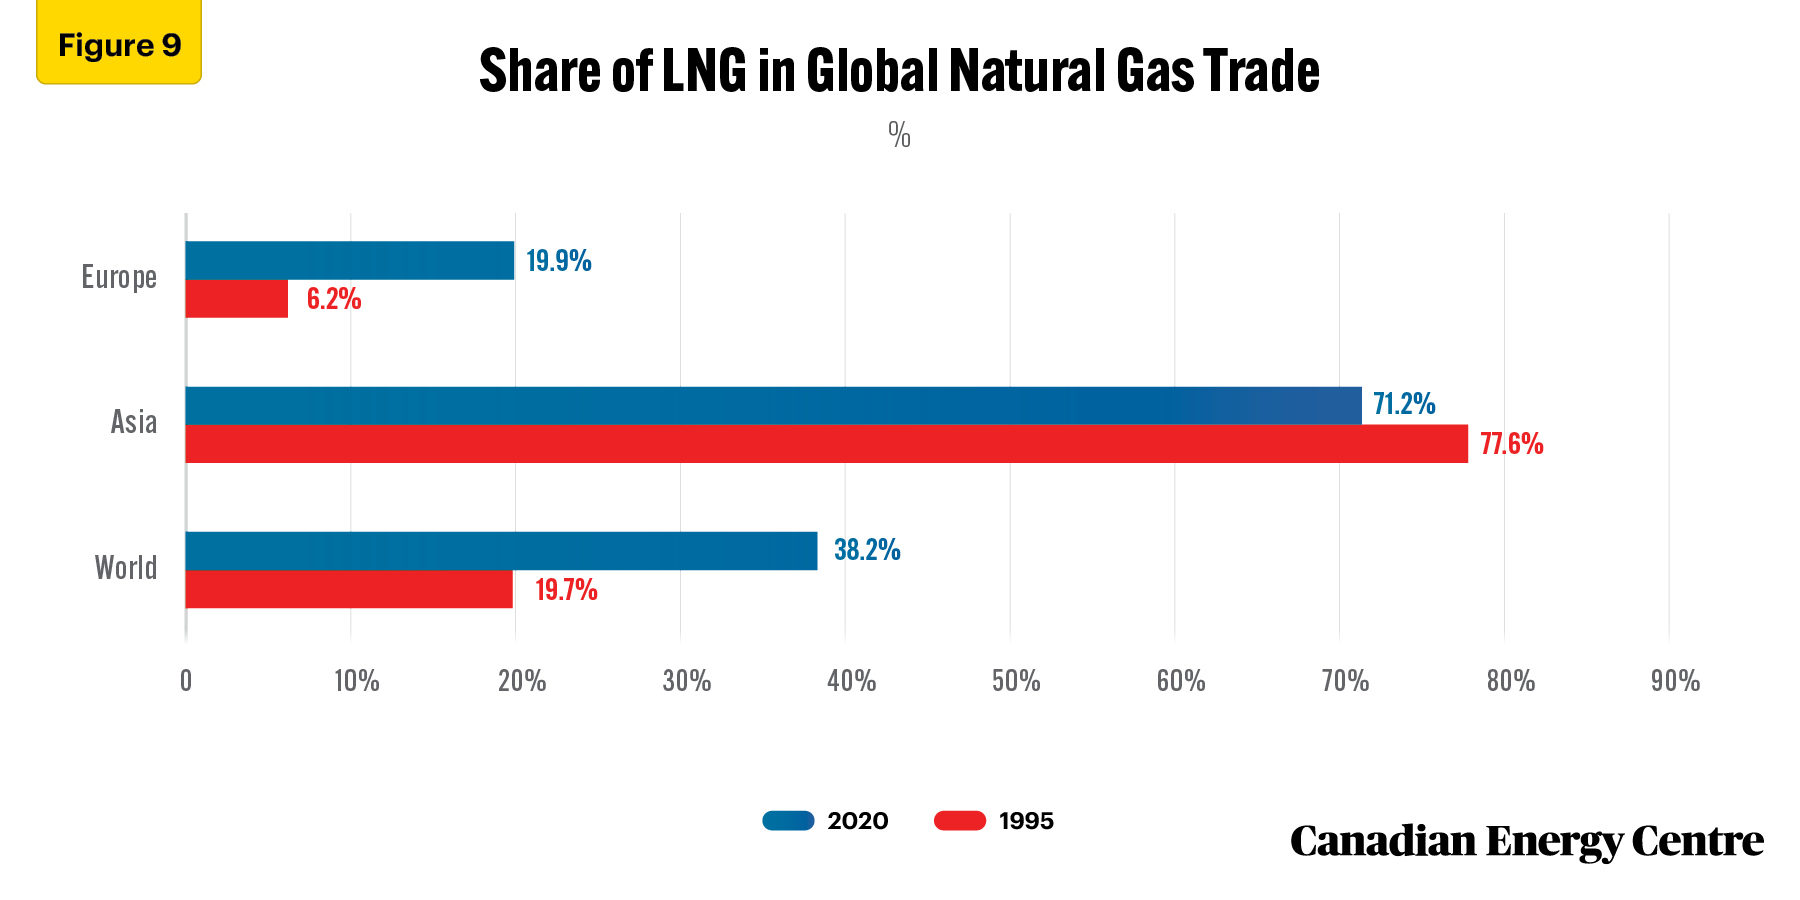
Historically, major economies in Asia and Europe have relied on imported natural gas to meet a significant portion of their natural gas needs. The share of LNG in the global natural gas trade increased from nearly 20 percent in 1995 to over 38 percent in 2020. In Asia, the share of LNG in natural gas imports is 77.6 percent, while in Europe, the share of natural gas that comes through LNG jumped from 6.2 percent to nearly 20 percent in 2020 (see Figure 9) (Derived from Enerdata, 2022).
A recent Shell study, Shell LNG Outlook 2022, projects LNG demand will double by 2040 and reach over 700 million tonnes (MT) from its current 2021 level of 380 MT (Shell, 2022).
Canada is the world’s fifth-largest producer of natural gas, and the largest exporter not exporting to Asia or Europe. For Canada to directly export natural gas to Asia and Europe, it will not only need to increase the volume of natural gas it produces but will need facilities on its west and east coast that can liquefy the natural gas in preparation for export.
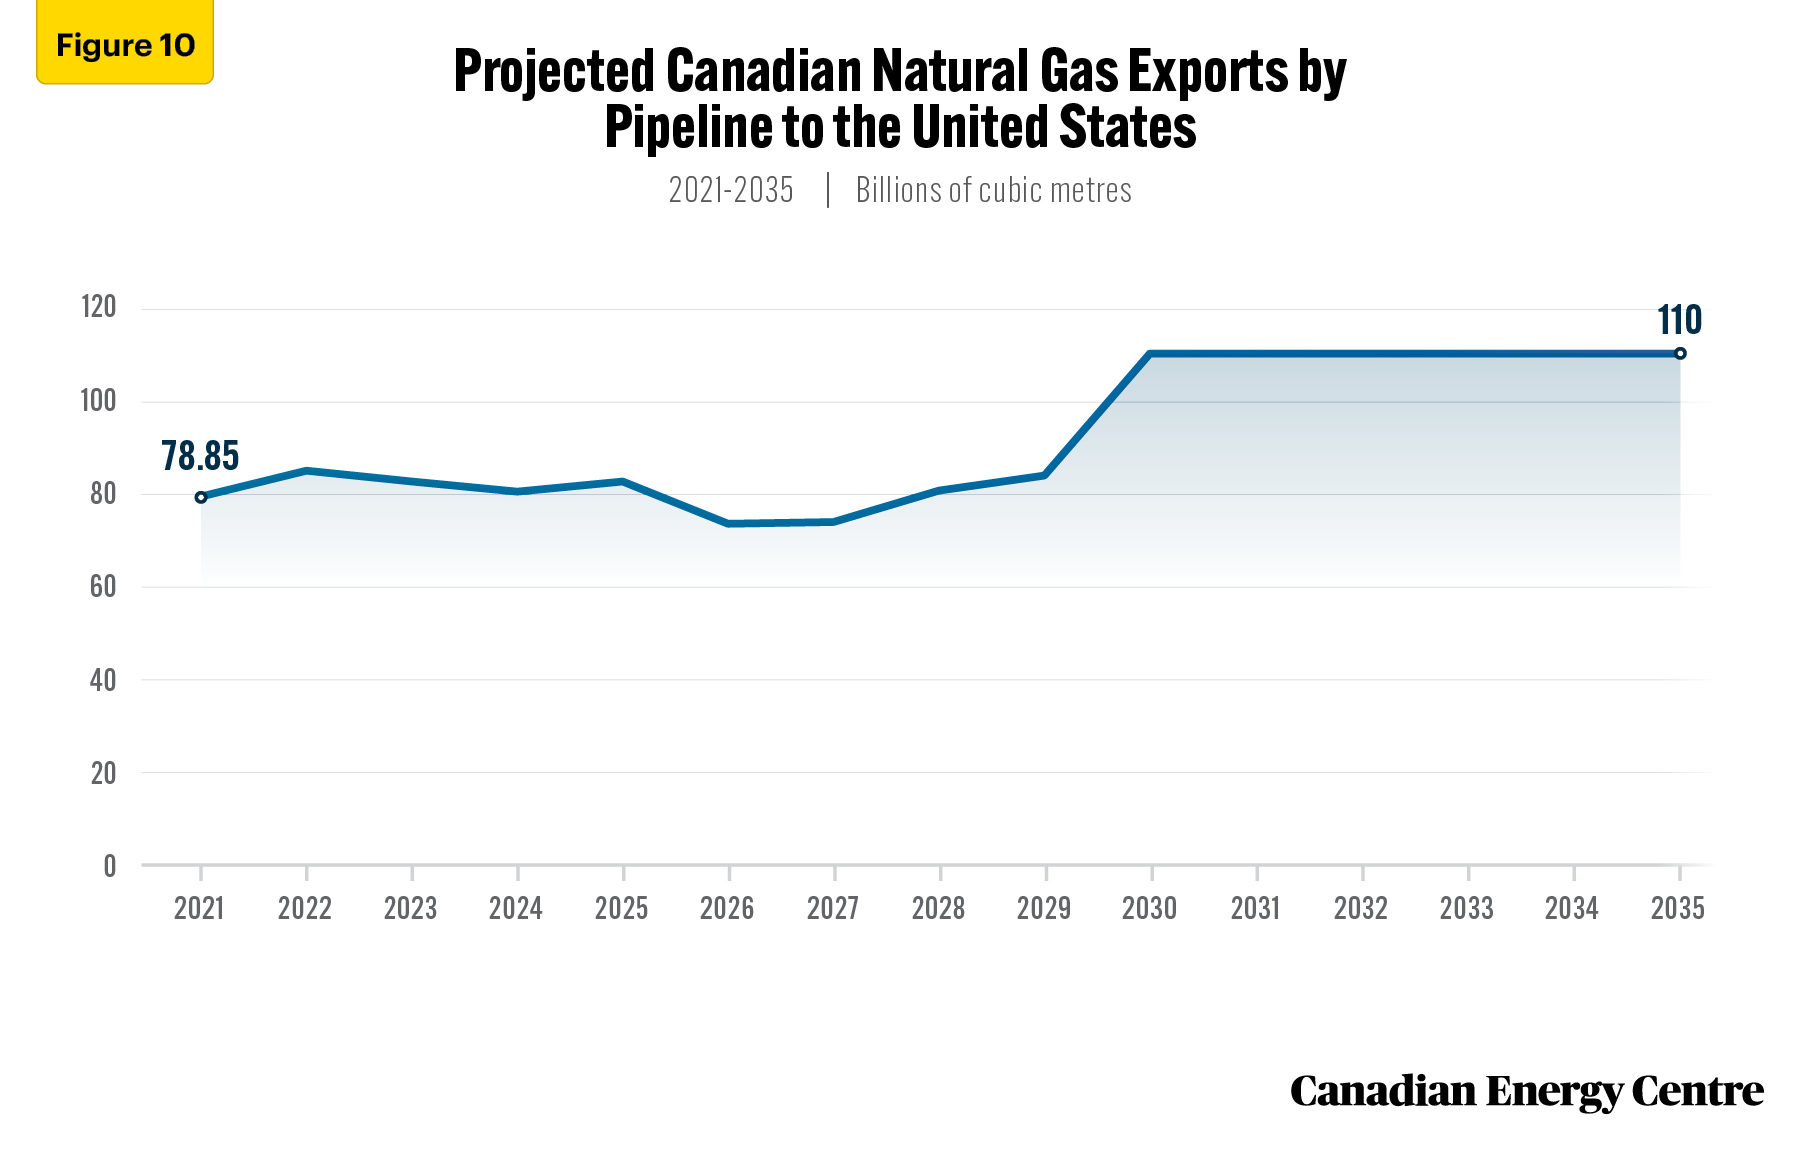
Canada’s natural gas market is integrated with the U.S. market. In 2021, Canada exported nearly 79 billion cubic meters (bcm) of natural gas by pipeline to the U.S. Canadian natural gas exports are projected to increase to 110 bcm by 2035 (see Figure 10) (Rystad Energy, 2022a).
As noted earlier, west coast Canadian LNG projects under construction and proposed have several advantages over those in other countries. One clear advantage is the shorter distance between British Columbia’s coast and many Asian markets than from facilities in the USGC. For example, the distance between the US Gulf Coast and the Japanese ports of Himeji or Sodegaura is more than 9,000 nautical miles, compared to less than 4,200 nautical miles between those Japanese ports and the coast of British Columbia (Steuer, 2019).
One of the main challenges for LNG projects in Canada is construction cost. Factors pushing prices up are ongoing inflation and the cost of finance (the rise in interest rates), which both affect construction costs. Increasing construction costs mean that projects would need to be able to secure higher prices to be confident of a minimum rate of return on investment before they bring their products online.
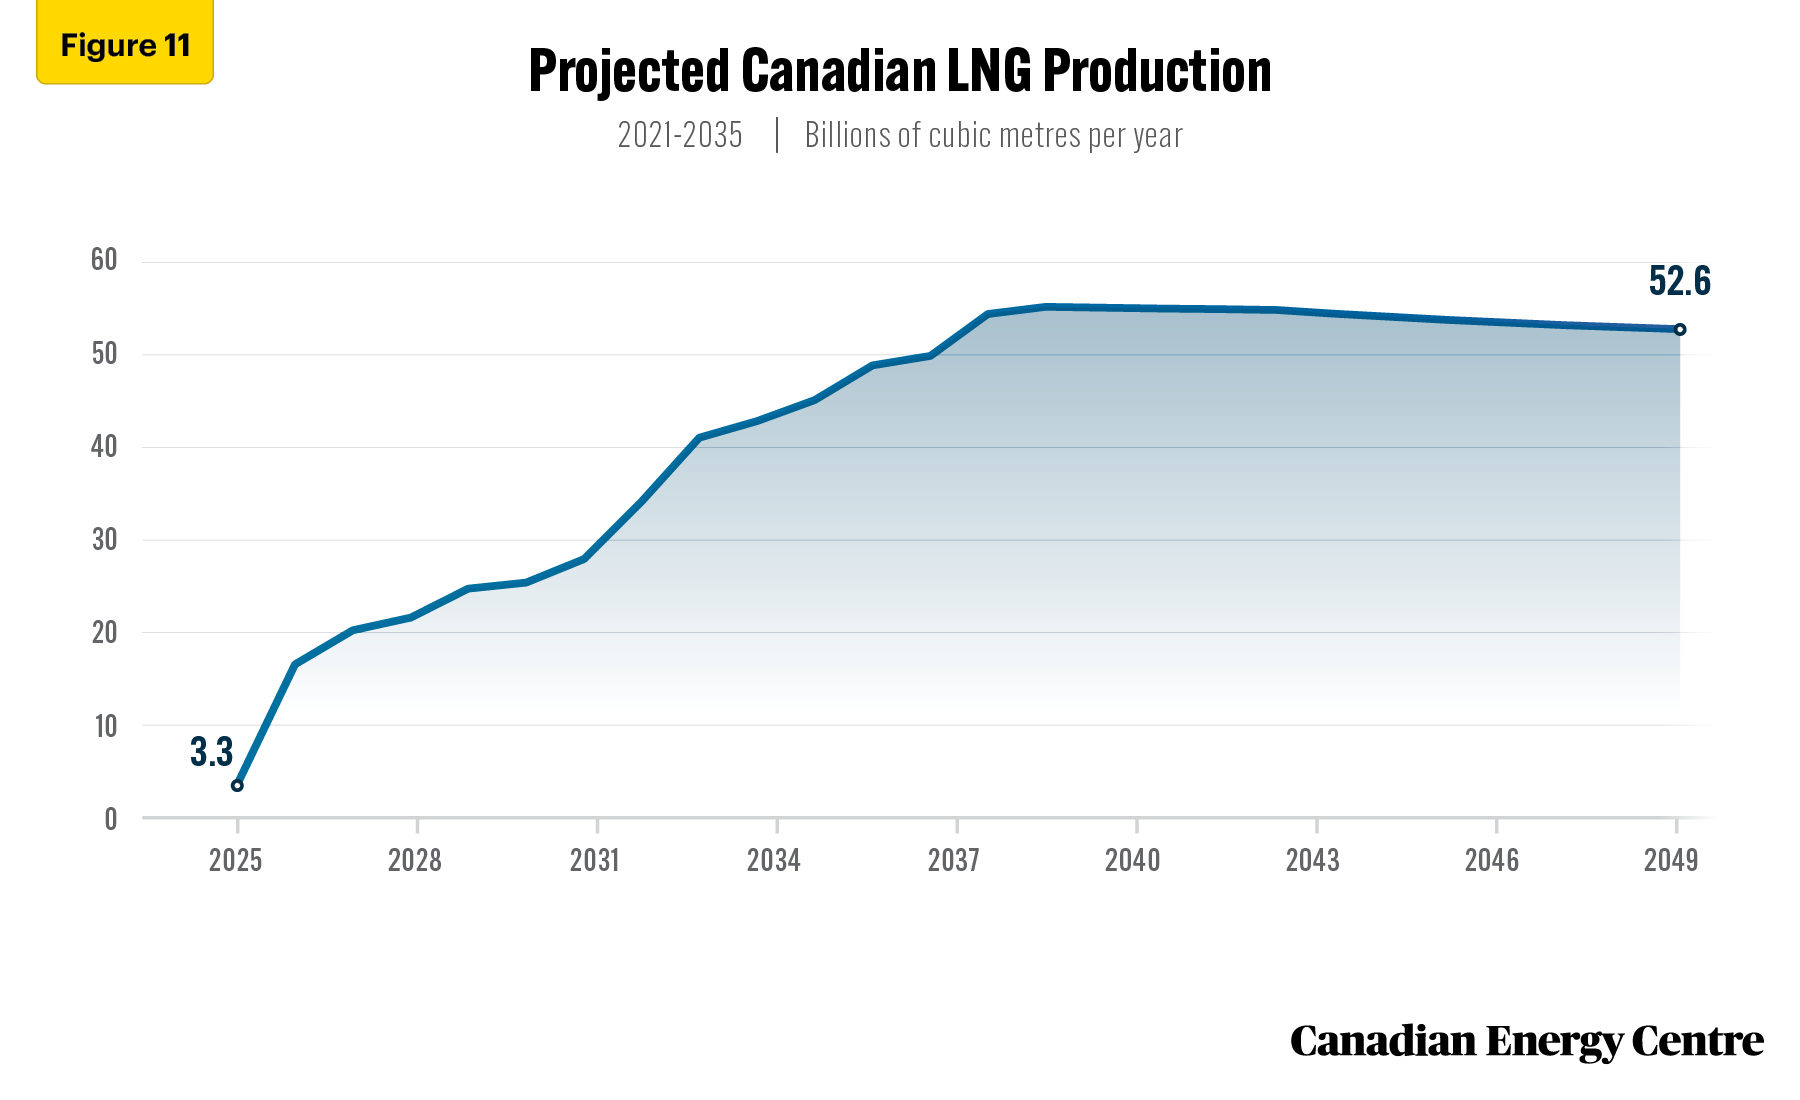
According to Rystad Energy, assuming all planned LNG facilities go forward, Canadian LNG production would begin in 2025 at 3.3 bcm per year, rise to 55.1 bcm per year by 2039, and then fall slightly to 52.6 bcm by 2050 (see Figure 11) (Rystad Energy, 2022). Most of this LNG would be exported to the Asia-Pacific through BC’s west coast. Still, there is a possibility that some of Canada’s natural gas production could be directed to Europe if suitable liquefaction infrastructure were built on Canada’s east coast.
Various studies have estimated the potential contribution that LNG exports could make to the Canadian economy. One of those reports, a 2016 Conference Board study, estimated that an LNG export industry equivalent to 30 MTPA in British Columbia could add roughly $CA7.4 billion annually to Canada’s economy over the next 30 years and raise national employment by 65,000 jobs annually (Conference Board of Canada, 2016).
Canadian Energy Centre (CEC) Research Briefs are contextual explanations of data as they relate to Canadian energy. They are statistical analyses released periodically to provide context on energy issues for investors, policymakers, and the public. The source of profiled data depends on the specific issue. All percentages in this report are calculated from the original data, which can run to multiple decimal points. They are not calculated using the rounded figures that may appear in charts and in the text, which are more reader-friendly. Thus, calculations made from the rounded figures (and not the more precise source data) will differ from the more statistically precise percentages we arrive at using the original data sources.
Did you enjoy this article?
You May Also Enjoy...
 NATURAL GAS: Essential to the energy eco-system
 Construction Underway at Vancouver Landfill for Renewable Natural Gas Facility
 ABB to deliver integrated automation, electrical & digital solutions to Phase 1 of Rio Grande LNG
 Unleashing Energy Revolution: Global LNG Demand Set to Skyrocket Beyond 2040
 Locus Technology That Reduces Carbon Intensity of Crude Oil & Natural Gas Production Is Certified by SGS